DEMOGRAPHICS & DATA
This page is best viewed on screens larger than cell phones.
|
|
POPULATION
|
|
|
Top 10 U.S.
CITIES 1 - New York
2 - Los Angeles 3 - Chicago 4 - Houston 5 - Phoenix 6 - Philadelphia 7 - San Antonio 8 - San Diego 9 - Dallas 10 - San Jose |
Overall
Population 8,804,190
3,898,747 2,746,388 2,316,120 1,680,992 1,584,064 1,547,253 1,423,851 1,343,266 1,021,795 |
African American
2,139,418
354,182 812,930 524,380 119,350 666,890 108,307 91,231 326,488 30,653 |
|
Source: US Census, 2019 and 2020 Estimates
|
Top 10 U.S.
METROS 1 - New York City
2 - Los Angeles 3 - Chicago 4 - Dallas 5 - Houston 6 - Washington DC 7 - Miami 8 - Philadelphia 9 - Atlanta 10 - Boston |
|
Source: Pew Hispanic, 2016 Estimates
|
|
VARIOUS KEY INDICATORS
|
|
|
Top 10 U.S. Cities
by Population 1 - New York
2 - Los Angeles 3 - Chicago 4 - Houston 5 - Phoenix 6 - Philadelphia 7 - San Antonio 8 - San Diego 9 - Dallas 10 - San Jose |
Poverty Rate
% of Residents 17.9%
18.0% 18.4% 20.1% 18.0% 24.3% 17.8% 12.8% 18.9% 8.7% |
|
Source: US Census
|
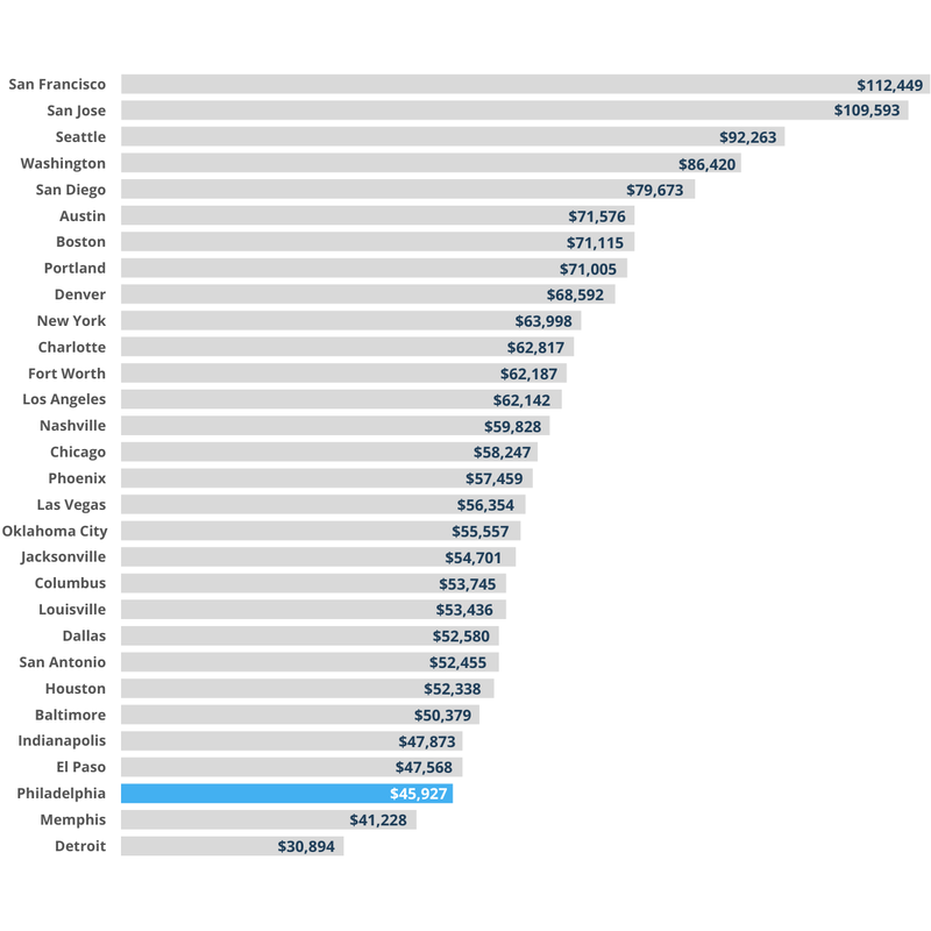
MEDIAN HOUSEHOLD INCOME IN 30 LARGEST CITIES |
|
Source: US Census Bureau, American Community Survey, 2019 five-year estimate